
Retirement Planner asks a household a guided set of questions, then runs their exact numbers through thousands of simulated market futures to answer one central question: will the money actually last? This guide walks through every step of the intake, the results dashboard, and all 30+ findings the app produces — in plain language, no formulas, no code, just the reasoning behind each chart.
What's inside
The guide is organized to mirror the app itself, start to finish:
- The 9-Step Guided Workflow — what each step of the intake collects and why it matters, from Client Profile through Review & Run.
- How the Simulation Works — a plain-language explanation of the Monte Carlo engine behind every chart: thousands of independently random simulated futures, not a single average projection.
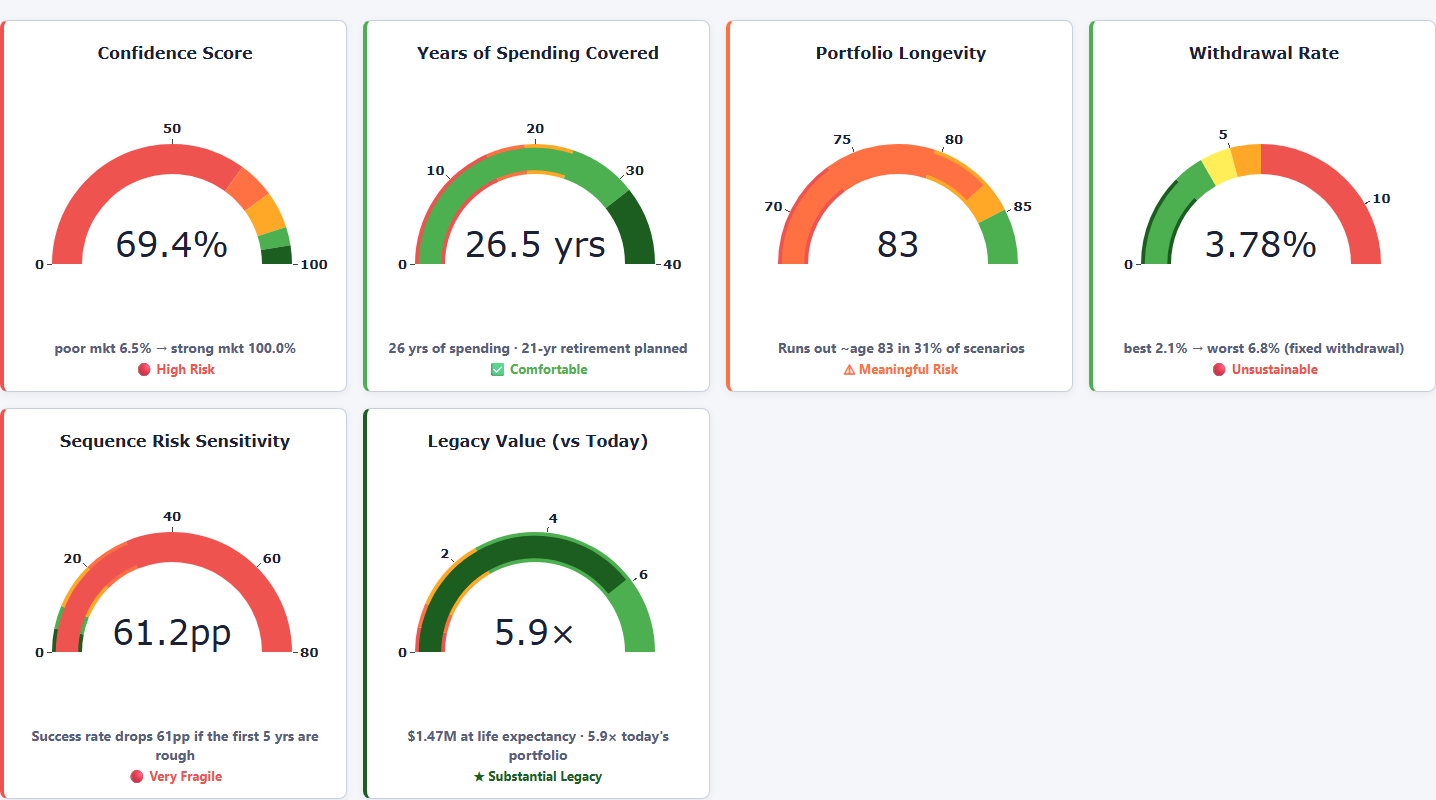
- The Results Dashboard — the six KPI gauges shown above every finding: Confidence Score, Years of Spending Covered, Portfolio Longevity, Withdrawal Rate, Sequence Risk Sensitivity, and Legacy Value.
- The Timeline Exploration Panel — the year-by-year slider shown alongside every finding, and how its numbers stay consistent with the charts around it.
- All 30+ Findings — every chart the app produces, organized into Foundational, Intermediate, and Advanced tiers, each with the specific question it answers.
- Things Worth Knowing — a few honest caveats about how certain findings are calculated, so nothing is taken as more precise than it actually is.
Who this is for
Anyone using the Retirement Planner who wants to understand what's actually happening behind a chart before trusting it — or anyone deciding whether the tool is a good fit for their own planning process.
Try it yourself
Run your own numbers at app.omnivectors.com, free to start.